
Fun statistics questions are engaging prompts, puzzles, and survey queries designed to explore probability, data patterns, and counterintuitive real-world math logic. They break down complex statistical principles—like the Birthday Paradox or Monty Hall Problem—into entertaining, relatable icebreakers and educational challenges for classrooms, trivia games, and party conversations.
Have you ever wondered how many people need to stand in a single room before two of them share a birthday? Asking fun statistics questions reveals how strange, surprising, and entertaining real-world data math can actually be.
For most people, high school math classes made data analysis feel like endless textbook formulas and dry calculations. Today, exploring fun statistics questions shows us how probability shapes our everyday decisions, sports games, and party tricks.
Whether you want to host an engaging game night or break the ice at work, you are in for a treat. Uncovering these fun statistics questions turns intimidating numbers into memorable lightbulb moments that anyone can easily understand.
Let’s explore brain-bending paradoxes, icebreaker survey ideas, probability secrets, and practical data tricks. Get ready to challenge your intuition and see numbers in a whole new light!
The Magic of Math: Why Statistics Can Be Deeply Entertaining
Many of us grew up thinking that math was strictly about memorizing formulas and passing timed exams. However, statistics is actually the science of storytelling using real-world clues and patterns.
When you look at data through a creative lens, numbers quickly turn into fascinating mysteries waiting to be solved.
Shifting from Boring Equations to Curious Mind Puzzles
Traditional classrooms often start with scary Greek symbols, heavy software programs, and complicated equations. A far better approach is starting with a surprising question that challenges what your brain expects to happen.
When a mathematical outcome completely contradicts your gut instinct, curiosity takes over instantly.
- The Surprise Factor: Probability often yields results that feel completely wrong to our everyday intuition.
- Real-World Relevance: Data patterns explain everything from traffic jam timing to online recommendation algorithms.
- Conversational Value: Fun mathematical facts make incredible icebreakers for dinner parties and group meetings.
- Creative Problem Solving: Working through probability paradoxes sharpens your critical thinking skills effortlessly.
How Counterintuitive Math Challenges Our Intuition
Our human brains are wired to think linearly and rely heavily on personal experiences rather than raw probabilities. When presented with large sample sizes or compounding chances, our instincts often fail us completely.
Learning to recognize these mental traps makes you a smarter thinker, a better decision-maker, and a far more entertaining conversationalist.
Famous Probability Paradoxes That Will Blow Your Mind

Some of the best data teasers come from classical probability problems that have stumped scholars for decades. These famous paradoxes prove that what feels obvious is frequently mathematically false.
Let’s break down three iconic puzzles using simple, everyday language.
The Birthday Paradox: A Room Full of Surprises
Imagine hosting a party and wondering how many guests must arrive before there is a fifty percent chance two people share an exact birthday. Most people guess around 180 people, thinking of the 365 days in a complete calendar year.
The real answer is just 23 people.
Because you are comparing every single person to every other guest in the room rather than just to yourself, the total number of pair combinations grows rapidly. With 23 guests, there are 253 unique pairs to compare, pushing the probability over fifty percent.
The Monty Hall Problem: Should You Switch Doors?
Imagine competing on a game show with three closed doors. Behind one door is a brand-new car, while behind the other two doors sit ordinary farm goats.
- You Pick Door 1: You choose your door, but it remains closed for a moment.
- Host Opens Door 3: The host, who knows where the car is, opens Door 3 to reveal a goat.
- The Big Choice: The host asks if you want to keep Door 1 or switch your guess to Door 2.
Mathematical logic proves you should always switch doors.
When you first chose, you had a one-third chance of picking the car and a two-thirds chance of picking a goat. When the host eliminates a goat, that original two-thirds probability concentrates entirely onto the remaining unopened door. Switching doubles your odds of winning from one-third to two-thirds!
The Simpson’s Paradox: When Groups Lie
Simpson’s Paradox happens when a clear trend appears in several different groups of data, but completely reverses when those groups are combined together. This occurs because underlying variables—like sample size or difficulty levels—skew the overall totals.
It reminds us to look beneath simple averages before jumping to major conclusions.
Icebreaker Survey Questions for Groups and Events
Gathering data from friends, students, or coworkers is one of the easiest ways to make statistics interactive and personal. Survey questions work best when they compare preferences, daily habits, and silly personal debate topics.
Here are engaging survey prompts designed to get people talking and graphing.
Silly Personal Habits and Daily Choices
- Alarm Clocks: How many times do you press snooze before actually getting out of bed each morning?
- Cereal Milk: Do you pour the cereal into the bowl first, or do you pour the milk first?
- Sock Habits: Do you put on both socks first, or do you put on one sock and one shoe at a time?
- Shower Routines: How many minutes do you spend daydreaming in the shower compared to washing?
Pop Culture Debates and Pet Preferences
Asking group members to vote on harmless pop culture debates creates instant engagement and clean data sets for plotting simple bar charts. You can quickly turn the responses into percentages and compare subgroups across the room.
- Pineapple on Pizza: Is pineapple an acceptable pizza topping, or is it a culinary crime?
- Dog vs. Cat Loyalty: Would you rather spend a weekend with five energetic puppies or three calm cats?
- Movie Streaming: Do you watch movies with subtitles turned on even when the audio is in your native language?
- Superpower Choice: Would you choose the ability to fly or the ability to become completely invisible?
Statistics in Everyday Life: Sports, Weather, and Luck
Statistics is not just an abstract academic subject; it actively governs the modern world around us every single day. From predicting weather patterns to analyzing professional sports plays, numbers run the background of daily life.
Understanding these practical applications helps demystify the choices made by businesses and algorithms.
How Sports Analytics Changed Professional Games
Modern sports teams no longer rely solely on scout instincts or basic win-loss records to evaluate talent. Advanced metrics track player movement speeds, shot angles, and spatial positioning during every second of a live game.
In basketball, teams realized three-point shots and close-up layups offer significantly higher point values per attempt than mid-range jump shots, completely changing how the game is played today.
Understanding Weather Forecast Percentages
When a meteorologist says there is a forty percent chance of rain tomorrow, what does that really mean? Many people assume it means it will rain for forty percent of the day, or across forty percent of the city.
In reality, it means the forecaster is certain precipitation will form, but expects it to cover forty percent of the designated forecast area.
How to Spot Misleading Statistics in the Wild
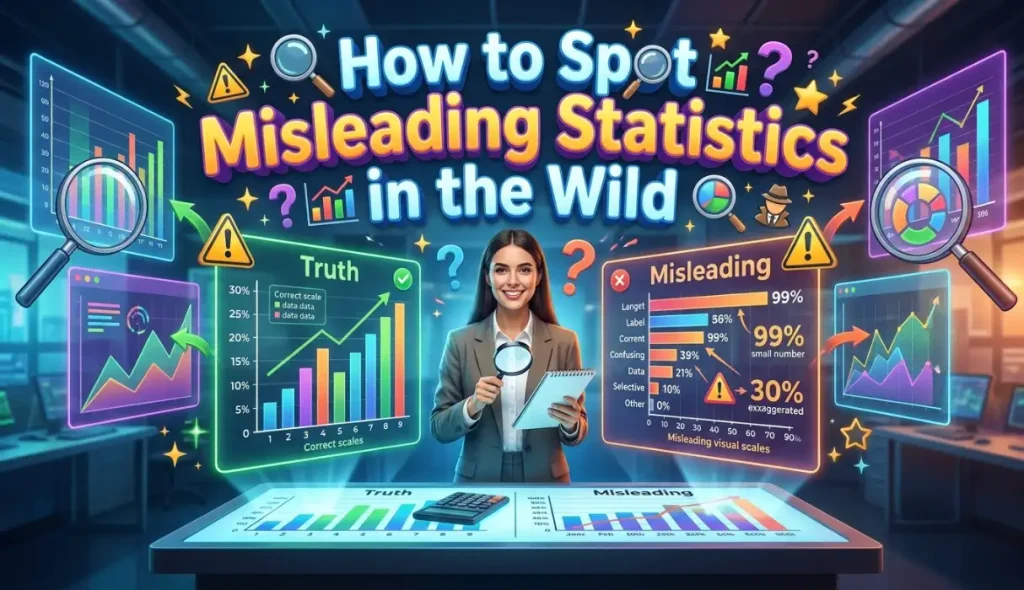
Not all published data numbers tell an honest story. Companies, advertisers, and media outlets frequently manipulate visual graphs and selective sampling to make their products or points look better than they really are.
Learning basic data literacy protects you from falling for deceptive claims.
Tricky Graph Axes and Truncated Visuals
One of the most common ways to fake a dramatic trend is by chopping off the bottom of a visual bar chart axis. Starting a vertical axis at 90 instead of 0 makes a tiny one percent increase look like a massive jump on screen.
Always check the numerical labels on both axes before trusting the visual slope of a line or bar graph.
Correlation versus Causation: The Ice Cream Fallacy
Just because two data trends move up and down together does not mean one event causes the other to happen. For example, ice cream sales and shark attacks both rise dramatically during the same summer months.
- The Hidden Variable: Hot summer weather drives more people to eat ice cream and more people to swim in the ocean.
- The False Conclusion: Eating delicious vanilla ice cream does not attract sharks to coastal beaches!
- Spurious Correlations: Random data sets can align perfectly by coincidence without any logical connection.
- Critical Questioning: Always ask if a third hidden factor explains both observations simultaneously.
Fun Classroom and Party Games Using Data
Bringing data concepts into group settings does not require computers or heavy spreadsheets. Simple hands-on games make learning probability active, memorable, and full of laughter.
Here are simple games you can run with basic household supplies.
The Coin Flip Streak Challenge
Give every player a standard coin and have everyone stand up in a room. Everyone flips their coin simultaneously; those who land on tails sit down, while those who flip heads remain standing.
Within just six or seven rounds, a room of one hundred people will narrow down to one lucky winner. This visually demonstrates exponential decay and independent probability events in under five minutes.
The Skittles Sampling Experiment
Hand out small, sealed bags of multi-colored candies to small groups of players. Have each group predict the color distribution of the entire candy factory based on the contents of their single small bag.
- Open Bag 1: Count individual colors and record the exact percentages on a shared board.
- Compare Groups: Notice how individual small bags vary wildly from one another.
- Combine All Data: Add all group counts together to see how larger sample sizes reveal true population averages.
- Enjoy the Treat: Eat the candy while discussing how sample size improves data accuracy!
Practice Exercise
Test your understanding of probability paradoxes, data literacy, and real-world statistics with these 5 multiple-choice questions.
- How many people need to be in a room for there to be a roughly 50% chance that two of them share a birthday?
A. 365 people
B. 180 people
C. 23 people
D. 2 people - In the famous Monty Hall Problem, what should a contestant do after the host reveals a goat behind an unchosen door?
A. Keep their original door choice because the odds never change.
B. Always switch to the other unopened door to double their chances of winning.
C. Flip a coin because both remaining doors have a 100% chance of containing a car.
D. Walk off the stage immediately without picking a door. - What hidden variable explains why ice cream sales and shark attacks rise at the same time during summer?
A. Sharks loving the taste of dairy products.
B. Warmer weather driving more people to beaches and ice cream shops.
C. Ice cream wrappers blowing into ocean currents.
D. High ocean tides pushing ice cream trucks into coastal waters. - Why do advertisers sometimes truncate or cut off the bottom of a bar chart’s vertical axis?
A. To save ink when printing paper charts.
B. To make small, insignificant data changes look visually dramatic and large.
C. Because numbers below zero do not exist in math.
D. To fit more decorative pictures on the slide. - What happens to the accuracy of a data sample as the total sample size gets larger?
A. The sample becomes less reliable and completely random.
B. The sample becomes more accurate and closer to the true population average.
C. The data turns into pure noise without any clear patterns.
D. The math becomes impossible for computers to calculate.
Answer Key:
- C
- B
- B
- B
- B
FAQs
Why is probability so hard for our human brains to guess correctly?
Our brains evolved to recognize simple cause-and-effect relationships in our immediate surroundings rather than calculate compounding mathematical odds across large groups. We rely on emotional intuition and recent memories, which often misjudge true statistical probabilities.
How can I use fun statistics questions as icebreakers at work?
Start meetings by asking simple preference questions or presenting a quick paradox like the Birthday Problem. Showing how group answers form an unexpected data distribution gets people laughing, engaging, and thinking critically without feeling tested.
What is the difference between correlation and causation in simple terms?
Correlation means two things happen at the same time, while causation means one thing directly makes the other thing happen. For example, wearing winter coats correlates with drinking hot chocolate, but wearing a coat does not force hot chocolate to appear.
What is the easiest way to explain Simpson’s Paradox to a beginner?
Explain that looking at smaller individual groups can show one result, but combining all those groups flips the result upside down. It happens when one group has much larger numbers or harder conditions than the others.
Can learning statistics help me make better financial choices?
Yes, understanding statistics helps you calculate real risk, evaluate investment claims, and avoid falling for predatory gambling odds or misleading product advertisements. It teaches you to look past flashy sales numbers and evaluate raw data objectively.
Conclusion
Exploring these fun statistics questions proves that numbers are far more than boring formulas in an old textbook. From mind-bending probability paradoxes to practical daily weather forecasts, statistical thinking unlocks a fascinating new way to see the world.
Sharing these brain-teasers with friends and colleagues turns intimidating math into shared moments of discovery and delight.
Pick your favorite paradox from this guide, test it out at your next gathering, and start exploring the hidden patterns around you today!

Jack Olive is the creative mind behind buzzgiggles.com, a fun-focused website built to bring smiles, laughter, and lighthearted entertainment to everyday life. With a passion for humor and enjoyable content, Jack Olive creates and shares playful ideas, amusing stories, entertaining discoveries, and cheerful moments designed for readers of all kinds.
Through buzzgiggles.com, Jack Olive combines creativity, curiosity, and a positive sense of humor to explore the lighter side of life. Whether visitors are looking for a quick laugh, something interesting to share, or a cheerful break from their routine, the website offers content created with fun in mind. Jack Olive believes great entertainment should be easy to enjoy, memorable, and capable of brightening someone’s day.